Rebooting your Data Strategy - User Group Talk Companion
- MarkDataGuy

- Jun 28, 2020
- 8 min read
Hello,
I have a technical talk called "Rebooting your data strategy with the PowerPlatform and Microsoft 365", which I have presented a few times so I have decided to write a blog series to accompany it. Hopefully, this will be of use to anyone who has seen the talk and wants to find out more. It not my intention to explain how to build the solution in this blog. This is intended to accompany the examples that are demonstrated in my talk.
My talk is based on my own experiences of working with PowerBI and associated technologies as I started using it to solve customer problems. I find it interesting how PowerBI manages to find it's way onto the desktop of users without any IT resource been involved. It feels like there are business users out there who are searching for technologies to fix their data issues and they find PowerBI, download it, give it a go, and the next thing you know they are trying to build a data solution. Sometimes this works, other times, they get a bit stuck and might have to call for help, but they are happy with the technology.
I split this talk into 3 phases. Phase 1 is your typical first approach to a PowerBI solution. Phase 2 and 3 develop that solution further and give you feel for just how far you can take things. If you want to watch this talk, there is a recording of it here. This is a live recording of a session, so forgive me if it is not the most polished. As a companion blog, I will not dive into how I built the solution, but I will talk about my approach to the problem. The demo is largely based on a combination of a few different customer solutions.
The problem.
The problem that I want to solve is to combine three different sources of data, One source is company wholesale sales data from their ERP system. The second source is the excel sheets that they use to create budgets for their wholesale sales. The third source is retail sales files that are sent from retailers with the sales volumes of the company products and competitor products. Historically if this company wanted to combine these three sources, it involved lots of excel VLOOKUPS and tables. Adopting PowerBI allowed them to create an automated way of enabling reporting across their data sets.
Phase I
In this phase, which is typical of the first time you might approach a PowerBI solution, it all about PowerBI and a single dataset. The architecture looks like this.

Phase I architecture
You have the three on-premise data sources on the left. However, I have also introduced a 4th "Master Data" source. The master data source just maintains a mapping between the product codes used internally and the product codes used by the retailers (which the company has no control over). In the middle, we have a Power BI data gateway. This is a service, that once installed onto your network, allows PowerBI.com (and other components of the PowerPlatform) to connect to on-premise data sources. On the right, we have PowerBI.com which will host our solution and to which users can connect to using a browser or phone.
I am not going to go into detail on how to build the actual PowerBI solution, but let's focus on aspects of the solution.
PowerQuery is used extensively in this solution. Connections are made to source files and various transformations are made in order to get the source data into the shape that I want for my reporting. In the following image, you get a sense of one of the power queries that is connecting to my retail sales data source. Note the various steps applied to transform the data and also the actual M code that is generated.

Power Query used to shape data into the desired format
Once your work is done in Power Query, you can get onto the modeling stage which is all about creating relationships between tables, defining hierarchies, and hiding columns. In my case, I end up with a model that looks like this.

Modeling in Power BI
Once you have your model created you can then move on to the visualization stage. Here are my visualizations which for the purpose of this demo are simple. Now that your solution is ready, you can publish this to PowerBI.com.

Creating reports based on your data model in PowerBI
Once the model is published to PowerBI.com, you can then share the model and the reports with your users who can connect to it using a browser of their choice.

Our report published to PowerBI.com
That's it. You have achieved your objective and created a solution that combines different data sources. Success, but let's analyze what we've done here. The solution feels very standalone & isolated. Users who may be new to this type of reporting now have to connect to an external website that they may never have used before in order to get to their data. The solution works and is effective, but it feels a little bit isolated. Let's move on to phase two and see how we can further improve this solution.
Phase II
In phase two, we add a lot to our solution. While functionally the solution is the same, you are bringing your data a lot closer to your end-users and smoothing out some rough edges of the original solution. The architecture of this is as follows.

Phase II architecture
As in phase one, I still have my three data sources and my on-premise gateway connector. However, I no longer have my fourth on-premise master data Excel sheet. Instead, I have moved this data to a SharePoint online list. Using a list feels a lot more natural and more secure than an Excel sheet located on a file server.
As I now using a SharePoint list I also might as well introduce a SharePoint page which I can use as an entry point to my reporting solution for corporate users. PowerBI still plays the same role as before, however, I have introduced dataflows. Dataflows are a way of using a Power Query as part of the PowerBI service. As we saw in phase one when you create a power query you are creating M code. If you now need to create a second model and have the same data in it, and you end up creating another power query, you now are maintaining two versions of code in different datasets. Data flows allow you to abstract this concept into PowerBI.com. It still uses M code but now your Power Query runs in the cloud and stores the resulting data set in blob storage in Azure. If you have data that you believe you will reuse amongst multiple datasets then adopting the use of dataflows is a really good strategy
Also, in this phase, I want to introduce the use of Teams. Teams is gaining a lot of traction in companies and the ability to put your PowerBI reports directly into Teams brings that data significantly closer to end-users.
Finally, while PowerBI allows end-users to create their own reports there are times when they need a true ad hoc environment to work with. PowerBI “analyze in Excel” functionality enables an end-user to directly connect an Excel pivot table to your power BI data set.
Let's focus on aspects of Phase II
Dataflows. As outlined above, dataflows are power queries that run in the PowerBI Service as separate objects from Datasets. Once created, they can have their own refresh schedule and can be used across multiple datasets. Great for code centralization, data sharing, standardized data sets, etc.

Viewing the fields returned by the "Company Sales" data flow in PowerBI
You can create a data flow directly in the PowerBI service using a similar interface to what you get in PowerBI. If migrating a power query to a data flow, you can just create a blank data flow and copy and paste your M code from power query to the Data Flow.

A blank Query that you can paste M code into to create a data flow
To access the dataflow from PowerBI, you can use Get Data -> PowerBI Data flows and select the flow that you want to insert.

Connecting to a DataFlow from PowerBI
Master Data in Sharepoint
In phase I, I had a source excel sheet, now I have now migrated the contents of that list to SharePoint. In PowerBI, I can now use SharePoint as a data source for my master data
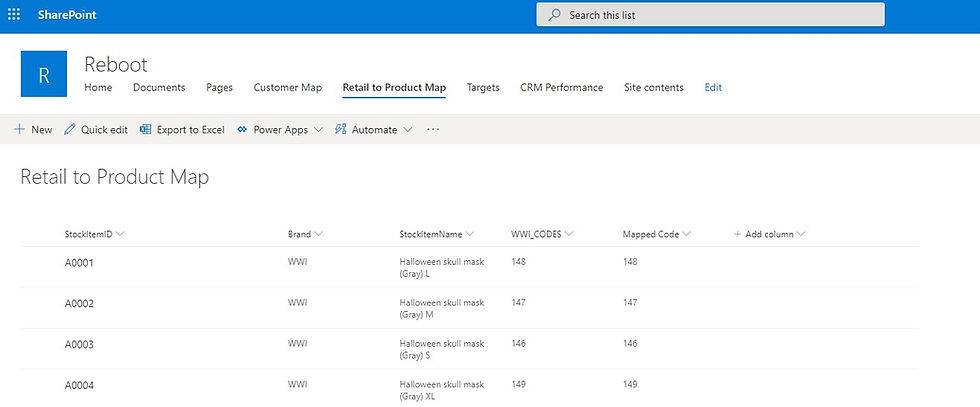
Master Data stored in a SharePoint List

Getting Data in a SharePoint List into PowerBI
Reports in Teams
While PowerBI is a wonderful resource, the practice of asking a user to go to "another" website in order to access their reports has always felt a bit disconnected to me. I believe that is is better to bring reports as close to a user as possible. Teams is one way that this can be achieved. You can embed a PowerBi report into teams as part of existing team groups. Now your users can access their reports along with all of their other business items in a single location that is part of their desktop applications. This is a view-only method of working with PowerBI reports, if users want to create their own reports, they still need to go to PowerBI.com or user PowerBI Desktop.

Viewing a PowerBi report in Teams
Of course, while we are talking about bringing reports closer to users, we can also achieve this via SharePoint online by embedding PowerBI directly into SharePoint pages.

A SharePoint Page with embedded PowerBI reports
Getting Adhoc
While PowerBI allows you to create Adhoc reports, in my opinion, it is not a full ad-hoc environment. There are plenty of times when users will want to get data into Excel. This is where Analyse in Excel comes in very useful. This allows you to connect to your data set directly from Excel and a user can now use an Excel Pivot table to work with their data. This is online connectivity to their dataset, so their data will always be up to date.

Creating a direct connection to PowerBI from Excel

Creating a Pivot Table that is connected directly to a PowerBI dataset
Phase III
At the end of Phase II, I have introduced a lot into the solution. I now have reports that are closer to users with some good practice around data sharing. There is however a rough edge that I want to sort out. My client receives files via email, which means that every week, someone has to take those attachments and save them to a file share. My last phase uses Power Automate to fix this.

Phase III architecture
Using Power Automate, a flow can be created that monitors an email account, and when it receives an email from a particular address, it removes the attachments and drops them to a file share. In my case, this depends on the use of the PowerBI gateway which can be used in two directions. When PowerBI refreshes, it connects to on-premise to get data, but the same gateway can also be used by the Power Platform to move data (or attachments in our case) to on-premise.
Power Automate has connectors to many different systems, over 300 at the moment. Based around these connectors you can create a trigger event, which when activated, will kick off some logic. In my case, the trigger event is when an email is received from a particular email address. When this happens, an "Apply to Each" operation will take the email attachments and execute a create file operation against a network share on my local network. The network is accessible via the PowerBI gateway. Finally, a refresh dataset command is issued on my PowerBI dataset

The Low/No-Code development environment of Power Automate
The job is now available on flow.microsoft.com

My flow in flow.microsoft.com
Conclusion
The purpose of this talk and blog was to give a user how PowerBi in combination with Teams/Office/SharePoint and Power Automat can be used to develop a sophisticated reporting solution. This is especially relevant for organizations that may not have many users, but still have a need for reporting. Before, these organizations were looking at expensive licenses to install on-premise. Now, using the power platform, they can achieve the same for a fraction of the license cost.
Thanks for reading.
Mark


Comments